
Sentinel Analytic Rule Failures: What to do?
Sentinel Analytic Rule Failures: What to do?
Health Monitoring is probably one of the most underrated and underused feature of Microsoft Sentinel. It is a powerful part of the product that needs to be used by every SOC that relies on Sentinel.
It is a common misconception that a PaaS product just runs fine and doesn’t require any maintenance.
After you have enabled Health Monitoring, you will notice a lot of errors require your attention.
Some of the most important errors are concerning Analytic Rules. If an Analytic rule fails to run, you might miss an incident. It is important that you monitor these failures and take action.
The behavior differs between Scheduled and NRT rules. So let’s walk through both of them.
Scheduled Analytic Rules
Analytic Rules can be configured to run at an interval between 5 minutes and 14 days. If an Analytic Rule fails, it will generate an error. This can be retrieved by using the following KQL query:
SentinelHealth| where TimeGenerated >ago(1d)| where SentinelResourceType == @"Analytics Rule"| where SentinelResourceKind == "Scheduled"| where Status != "Success"
t is important to note that analytic rules will try the same window 6 times. This means you should not take action if there are less than 6 failures for the same window. By adding a summarize operator focusing on the start time of the run, we can update the rule to only notify us when the window has missed, and Sentinel won’t execute a manual retry anymore.
SentinelHealth| where TimeGenerated >ago(1d)| where SentinelResourceType == @"Analytics Rule"| where SentinelResourceKind == "Scheduled"| where Status != "Success"| extend startTime = tostring(ExtendedProperties["QueryStartTimeUTC"])| summarize failuresByStartTime = count(),take_any(SentinelResourceId,TimeGenerated,SentinelResourceName,Status,ExtendedProperties,ErrorCode,ErrorDescription,OperationName,Description) by startTime, SentinelResourceId| where failuresByStartTime == 6
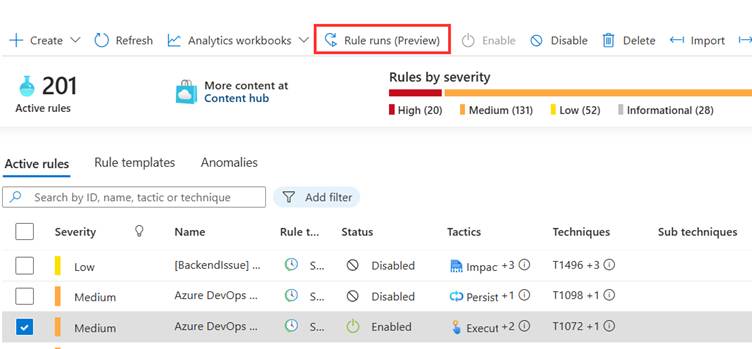
If there are more than 6 failures, you can run the failed analytic rule manually, this can be done by navigating to the analytic rules in the portal, select the rule and click ‘Rule runs’ at the top.
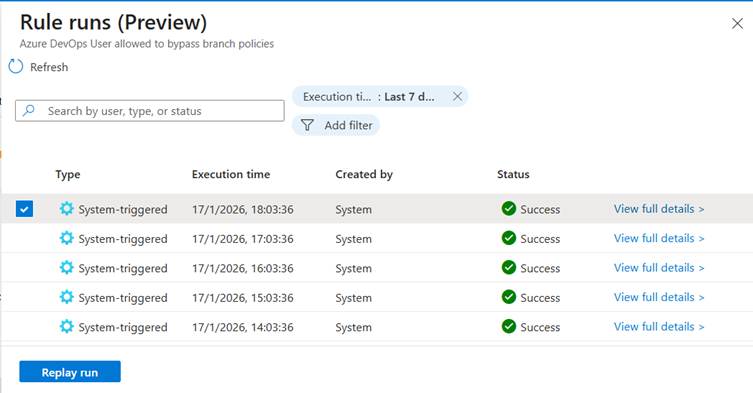
Here, select one or more rule runs and click‘replay run’.
By executing a manual run, you can identify if there is an issue with the query or Sentinel as a platform. If the query is still failing after this step, it is recommended to execute the query manually and verify the results.
It is recommended to setup the rule I added above as an analytic rule. This way, you will receive incidents when there are more than 6 failures and thus manual action is required.
NRT Rules
NRT rules behave a little bit differently. NRT rules run continuously and in ‘near-real time’. NRT rules will run the same window for up to 60 failures in an hour. This means you will only loose incidents if there are more than 59 failures. To be aware of this, you can create an analytic rule with the following query.
SentinelHealth| where TimeGenerated >ago(90m)| where SentinelResourceKind == "NRT"| extend startTime = todatetime(ExtendedProperties["QueryStartTimeUTC"]), endTime = todatetime(ExtendedProperties["QueryEndTimeUTC"])| extend ruleDelay = datetime_diff('minute', endTime, startTime)| where ruleDelay > 59
It is important to note is that this can still cause significant delays. If an NRT rule fails 30 times, your incident will be delayed for 30 minutes. NRT rules are created for critical actions, such as activity break glass accounts. In these kinds of scenario’s, a delay of 30 minutes of significant.
A major downside of NRT rules is that they cannot be re-run. So, if you experience failures, you either need to trust the backend or run the queries manually.
While working with SentinelHealth for the past year, I haven’t come across a lot of failures for NRT rules. So, I don’t find the limitation of not being able to re-run a rule large.
Defender XDR
Because of the Unified SOC experience, we are being pushed into Defender XDR. This means custom detections become the alternative of analytic rules. The question is: ‘How can we now when our custom detections are failing?’.
The simple answer is: We don’t. There is no way (as far as I know) that we can validate the health of our custom detections. This can have two potentials causes:
- Defender XDR already does automatic healing and doesn’t require any input.
- This capability needs to be developed.
While I hope the answer is the first point, I doubt that there is 0% chance that something will go wrong with custom detections.
Health Monitoring is one of the features that Sentinel is in front of Defender XDR, so I hope the team will ensure there is also feature parity for this.
Categories
